
How I Built an AI-Powered Data Engineering Weekly News Digest
- dhanasekar palani
- Apr 1
- 3 min read

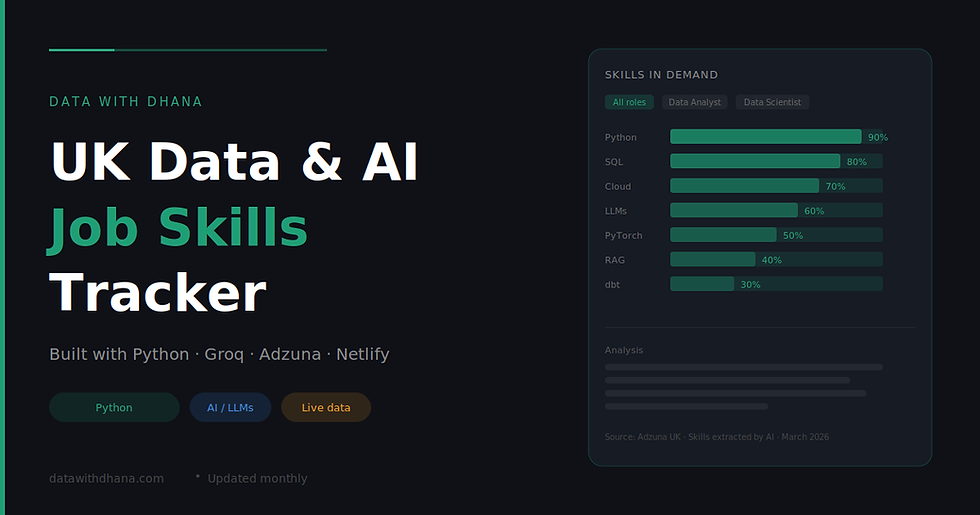
I have been on a streak of building small AI projects for this blog. After creating the UK Data & AI Job Skills Tracker, I wanted something that would give readers a reason to come back every week. A curated news digest felt like the right next step — but I did not want to spend hours manually reading and summarising articles. So I automated the whole thing with Python and AI.
Here is exactly how it works.
The problem it solves
The data engineering world moves fast. New releases from dbt, Databricks, Snowflake, and a dozen other tools drop every week. Keeping up means either subscribing to every blog individually or missing things entirely. I wanted a single page — updated weekly — that pulls the most important stories together and explains why each one actually matters to a data engineer.
How it works
The pipeline has three steps: fetch, summarise, publish.
Step 1 — Fetch articles from RSS feeds
Most major data tools publish an RSS feed. The script uses feedparser, a lightweight Python library, to pull the latest posts from 12 sources including dbt, Databricks, Snowflake, Airbyte, DuckDB, Dagster, Confluent, Pinecone, Microsoft Fabric, AWS, Google Cloud, and StarRocks.
For each feed it checks the publication date and only keeps articles from the last 10 days. This keeps the digest genuinely current rather than recycling old news.
One thing I learned: not all feeds use the same date field. Some use published_parsed, others use updated_parsed. The script checks for both so no articles get silently skipped.
Step 2 — Pick the top 10 and generate the HTML with AI
The filtered articles get passed to Groq's API running llama-3.3-70b-versatile. The prompt asks the model to act as a Lead Data Architect, select the 10 most impactful stories, and return them as styled HTML cards — not just plain text.
Each card includes a company badge, the article title, a two-sentence explanation of why the announcement matters to data engineers, and a read more link. The model is also given the brand hex colour for each company so the cards are visually distinct — Snowflake gets its cyan, Databricks gets its red, and so on.
To make the output reliable, the prompt explicitly tells the model to return only raw HTML with no markdown fences. There is also a fail-safe in the code that scans the output and force-adds target="_blank" to any link that is missing it, so articles always open in a new tab.
Step 3 — Wrap it in a full HTML page and save
The AI-generated card grid gets dropped into a pre-built HTML template styled with Tailwind CSS and the Plus Jakarta Sans font. The template includes a header with the current date, a footer, and hover animations on each card. The whole thing saves as index.html, ready to upload.
The tech stack
Component | Tool | Cost |
RSS parsing | feedparser | Free |
AI summarisation | Groq (Llama 3.3 70b) | Free |
Styling | Tailwind CSS | Free |
Language | Python 3.11 | Free |
Total cost: £0.
Why Groq instead of other models
I originally tried Google Gemini for the job skills tracker and hit regional restrictions — the free tier is not available in the UK. Groq has no such restriction, is genuinely free, and llama-3.3-70b-versatile is capable enough to write clean, structured HTML reliably. For a task like this — structured output with clear formatting rules — a well-prompted open model works just as well as a paid one.
How to run it yourself
Install the dependencies:
pip install feedparser groq python-dotenv
Add your Groq API key to a .env file:
GROQ_API_KEY=your_key_here
Then run:
python news_digest.py
The output is a single index.html file. You can open it locally in a browser, host it on Netlify for free, or embed it on your blog using an iframe.
What I would add next
The obvious next step is automation — a GitHub Actions workflow that runs the script every Monday morning and commits the new index.html to the repo. Netlify then redeploys automatically, so the digest updates itself without any manual work.
I also want to add a brief "Trend of the Week" section at the top that uses AI to spot common themes across all the articles — for example if three different tools all announced vector search support in the same week, that is worth calling out explicitly.
Built with Python, Groq, feedparser, and Tailwind CSS. Free to run, takes about 30 seconds.

Comments